Bitcoin at $80K: Anatomy of a $3 Billion Short Squeeze
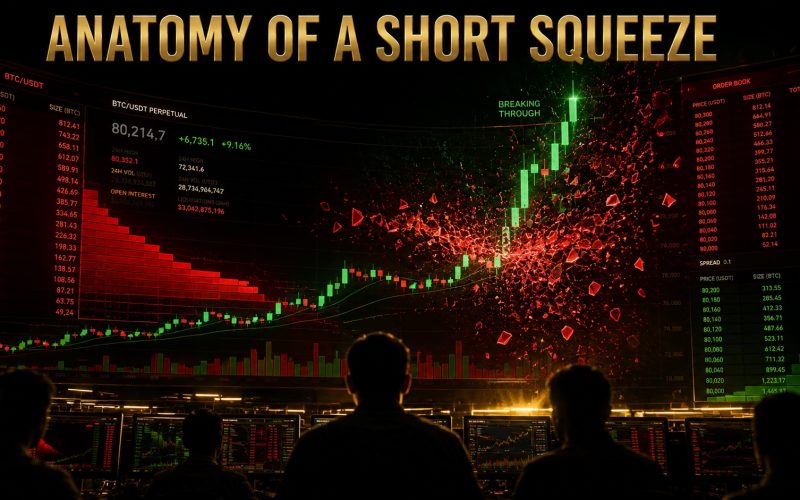
Bitcoin at $80K: Anatomy of a $3 Billion Short Squeeze
Bitcoin has just delivered its strongest week in more than two years, clearing $80,000 on 25 August 2026 after six weeks of going nowhere. The headlines credit a White House crypto meeting, a pending Senate vote and a Treasury liquidity announcement. Those things all happened, and they matter.
They are also not what actually moved the price.
The dominant force behind this move was mechanical: roughly $3 billion of leveraged short positions were force-closed across derivatives venues, and the exchanges closing them had to buy Bitcoin at market to do it. Understanding the difference between a squeeze and an accumulation is the difference between reading this rally correctly and mistaking forced buying for conviction. This article breaks down what happened, what the on-chain and derivatives data actually show, and what would need to change for this move to become something more durable.
Key Market Data
| Metric | Value |
|---|---|
| Bitcoin price | ~$80,900 |
| Session high, 25 Aug | $81,023 |
| Weekly gain | Over 25% |
| Range broken out of | $62,000 to $66,900, held since 8 July |
| Short liquidations, 19 to 20 Aug | ~$2.77 billion |
| Long liquidations, same window | ~$264 million |
| Short share of forced closures | ~92% |
| Peak hourly liquidation | ~$1.29 billion |
| Daily RSI | 82 to 84 |
| 2026 high | $94,820, mid-January |
| All-time high | $126,198, 6 October 2025 |
Data as of 25 August 2026. Verify before publishing.
1. What a Short Squeeze Actually Is
A short squeeze is not a sign that buyers have arrived. It is a sign that sellers have been forced to leave.
When a trader shorts Bitcoin with leverage, the position is collateralised. If price rises far enough, the collateral no longer covers the potential loss, and the exchange’s risk engine closes the position automatically. Closing a short means buying. That purchase is not optional, it is not price sensitive, and it happens whether or not the trader believes Bitcoin is worth the price being paid.
The feedback loop follows naturally:
- Crowded short positioning builds up over a quiet, range-bound period
- A catalyst pushes price through a level where many stops and liquidation prices cluster
- Risk engines issue forced market buy orders
- That buying lifts price further, triggering the next tier of liquidations
- The cycle repeats until the leveraged shorts are exhausted
The important property of this mechanism is that it is self-limiting. Forced buying stops when there is nothing left to force. That is precisely what makes a squeeze-driven rally structurally different from one built on sustained spot demand.
2. The Numbers Behind This Squeeze
Bitcoin had been trapped between roughly $62,000 and $66,900 since 8 July. Six weeks of a tightening range is exactly the condition that lets bearish leverage accumulate, because a market that keeps failing to break out looks, to a leveraged trader, like a safe place to sell.
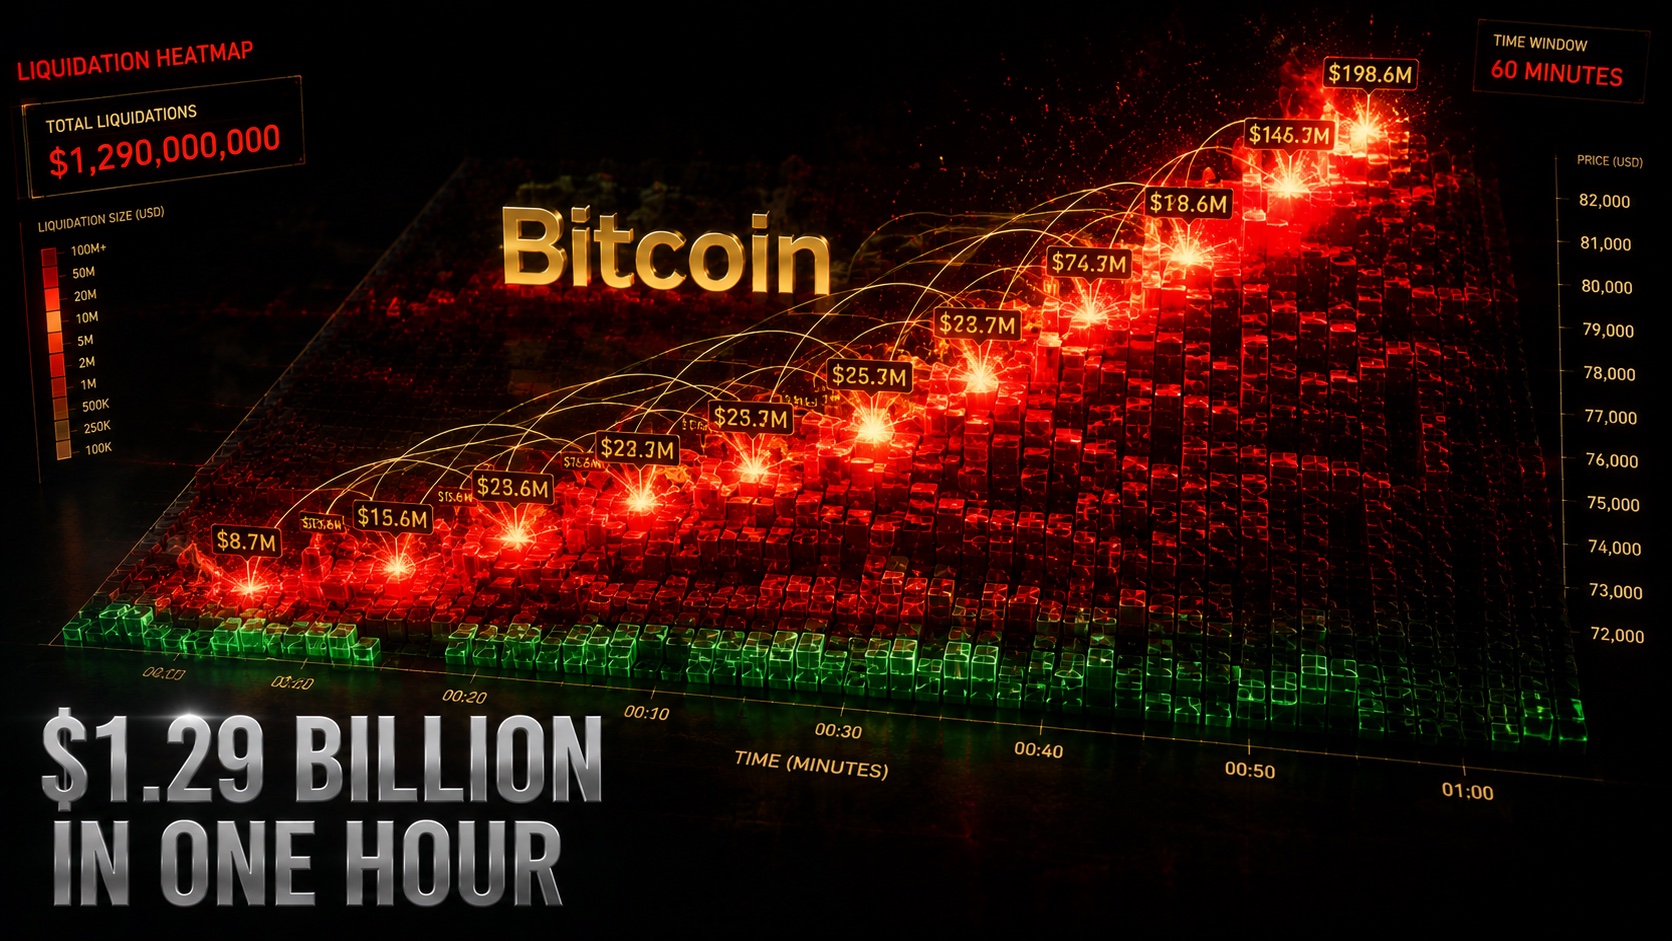
On 19 and 20 August, that positioning was destroyed. Across derivatives venues, more than $3 billion in leveraged positions were liquidated, and the split was extraordinarily one-sided:
- Short liquidations: approximately $2.77 billion, around 92% of the total
- Long liquidations: approximately $264 million, close to a rounding error by comparison
- Peak velocity: roughly $1.29 billion of shorts closed within a single hour, per CoinGlass data
- By venue: Binance around $518 million, Hyperliquid around $513 million, Bybit around $303 million
That ten-to-one asymmetry is the entire story in one number. In a normal liquidation event, both sides bleed. Here, one side was carried out almost alone. It ranks as the largest concentrated short squeeze since November 2021.
The venue breakdown carries its own signal. Hyperliquid absorbing nearly as much as Binance shows how much perpetual futures activity now sits on decentralised infrastructure rather than centralised exchanges, a shift we covered in our deep dive on Hyperliquid’s rise. Leverage did not disappear when it moved on-chain. It just became easier to observe.
It is worth stating plainly why crowded shorts build up in the first place. In perpetual futures markets, a funding rate periodically transfers payment between longs and shorts to keep the perpetual price tethered to spot. When shorts dominate, funding typically turns negative and shorts are paid to hold the position. Being paid to wait is comfortable, and comfort is how crowded positioning forms without anyone noticing.
3. The Macro Trigger: Treasury Buybacks
The spark came from the bond market, not from crypto.
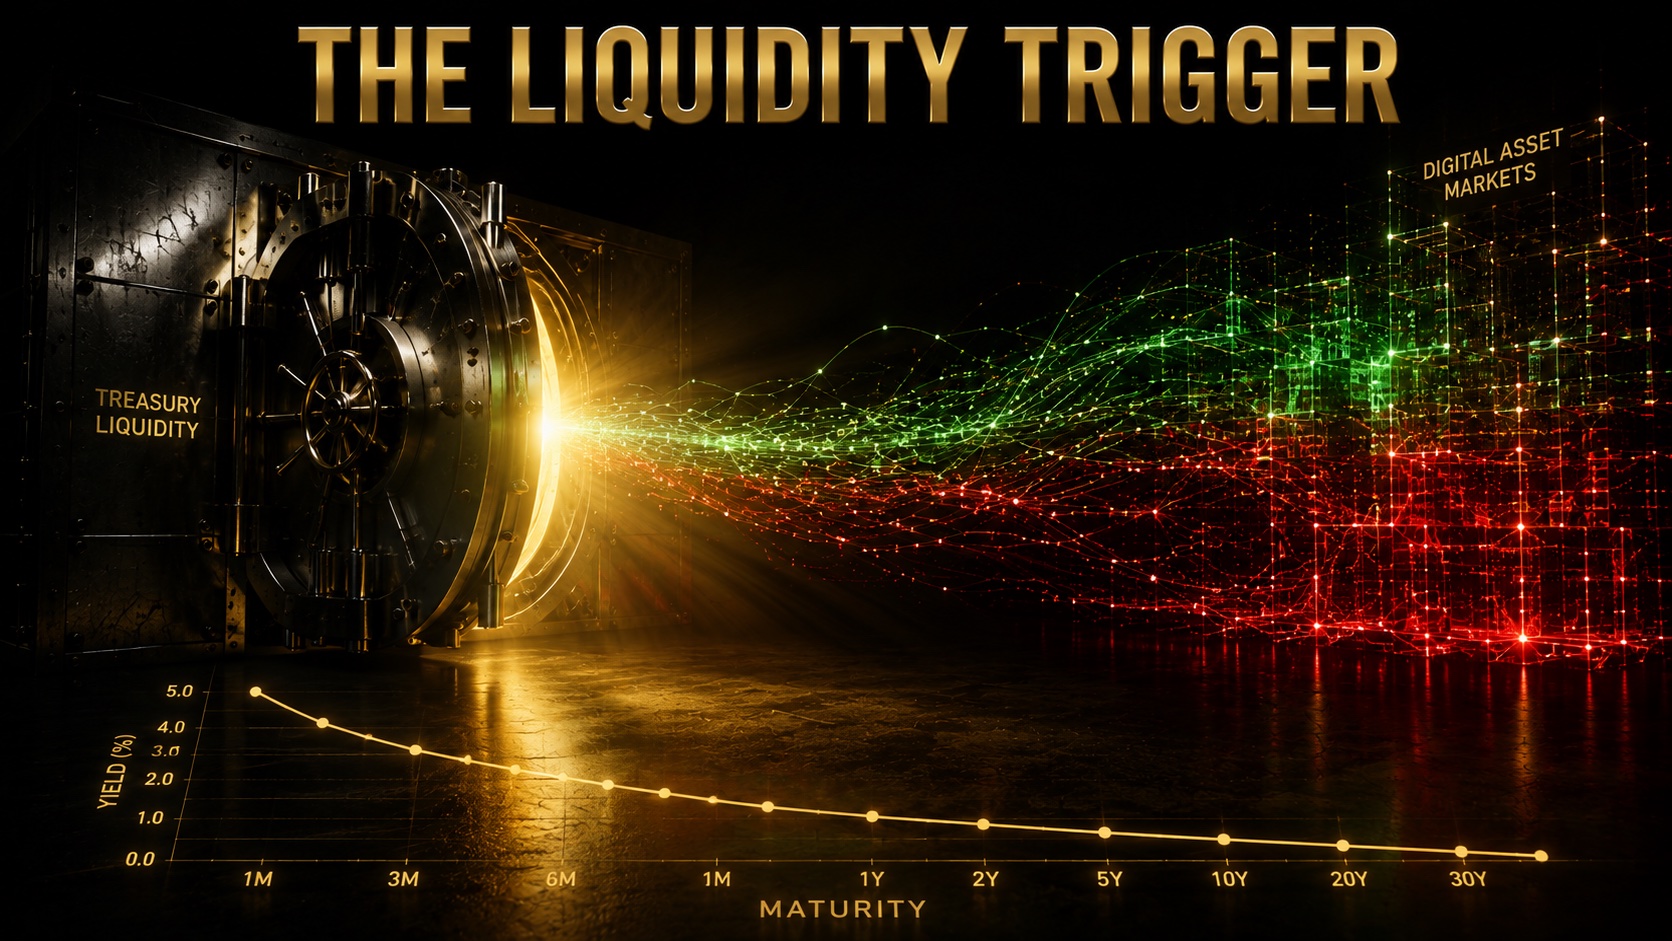
On 19 August, the US Treasury announced it would at least double the maximum size of its long-dated bond buyback operations, from $2 billion to $4 billion per operation, across a window running from 9 September to 4 November. The following day, Treasury Secretary Scott Bessent indicated the programme could be expanded beyond that $4 billion ceiling if conditions warranted.
The context matters. Total US public debt crossed $40 trillion in mid-August, and the 30-year Treasury yield had climbed to its highest level since 2007. The buyback expansion was a liquidity intervention aimed at a stressed long end of the curve.
Markets read it as a loosening of financial conditions, and liquidity-sensitive assets responded:
- The 30-year yield initially fell roughly 10 basis points to around 5.19%
- Ether rose about 18% in 24 hours, its strongest single day since March 2024
- Solana gained roughly 25% on the week, briefly touching $93.39 on 21 August
Two honest caveats belong here. First, this is not quantitative easing. A Treasury buyback swaps one government liability for another and does not expand the Federal Reserve’s balance sheet. The popular framing of it as “stealth QE” overstates the mechanism, even if the directional read on liquidity is fair. Second, the bond market itself was unconvinced: by 20 August, 30-year yields had rebounded and nearly erased the entire move. The asset the policy was aimed at stopped believing it within a day. Bitcoin kept rallying anyway, which tells you the squeeze had taken over from the catalyst.
4. Washington: Real Progress, Widely Overstated
The political layer is genuine but has been read too generously.
On 19 August, President Trump hosted crypto industry executives at the White House, including Coinbase chief executive Brian Armstrong, Tyler and Cameron Winklevoss of Gemini, and leaders from Ripple, Kraken, Chainlink Labs, Anchorage Digital, Grayscale and OKX. He urged Congress to pass the Digital Asset Market Clarity Act, framing it as necessary to keep the United States competitive in emerging technology. The meeting followed the SEC formally proposing new crypto fundraising rules on 18 August, including an exemption of up to $75 million per year.
The CLARITY Act itself would draw the jurisdictional boundary between the SEC and the CFTC, defining which digital assets are securities and which are digital commodities, and giving the CFTC a substantially larger supervisory role.
Here is where the market narrative and the legislative reality separate:
- Senate Majority Leader John Thune filed cloture on 8 August, more than a week before this rally began. It was not a fresh catalyst during the squeeze window.
- The 15 September vote is a cloture motion on the motion to proceed, which is a vote to begin floor debate, not a vote to pass the bill.
- It requires 60 votes. Republicans hold 53 seats, so at least seven Democrats or independents would need to cross over.
- A failed cloture vote could effectively kill the bill for this session.
The people pricing this with real money are notably unexcited. Polymarket traders have put 2026 passage odds at roughly 17%, and Galaxy Research cut its estimate to around 10% in mid-August. Prediction markets are not infallible, but they have a decent record precisely because participants are financially exposed to being wrong, a dynamic we examined in our piece on how Polymarket became a serious intelligence signal.
A market rallying on legislation that informed money gives a one-in-six chance of passing is not pricing the legislation. It is pricing sentiment, and using the legislation as the excuse.
5. Is There Any Real Demand Underneath?
This is the question that decides whether the rally survives, and the honest answer is that the evidence is mixed rather than absent.
On the constructive side, spot ETF demand did show up. BlackRock’s IBIT led weekly inflows with roughly $1.33 billion as Bitcoin broke above $69,000 for the first time in two months. Open interest rose through the week, which is consistent with new capital entering rather than only old positions closing. Regulated ETF flows are the closest thing this market has to verifiable, non-leveraged demand, and they were positive.
On the cautious side, the scale is mismatched. Roughly $1.33 billion of weekly ETF inflow is real money, but it is dwarfed by nearly $2.8 billion of short liquidations concentrated into about 48 hours. When forced buying is roughly twice the size of the genuine institutional bid, it is the forced buying that set the price.
The distinction matters for what comes next. ETF inflows are recurring, and they can continue next week. Short liquidations are non-recurring by definition, because those positions no longer exist. The bid that took Bitcoin through $70,000 cannot take it through $90,000, because it has already been spent.
6. Technical Position: Stretched
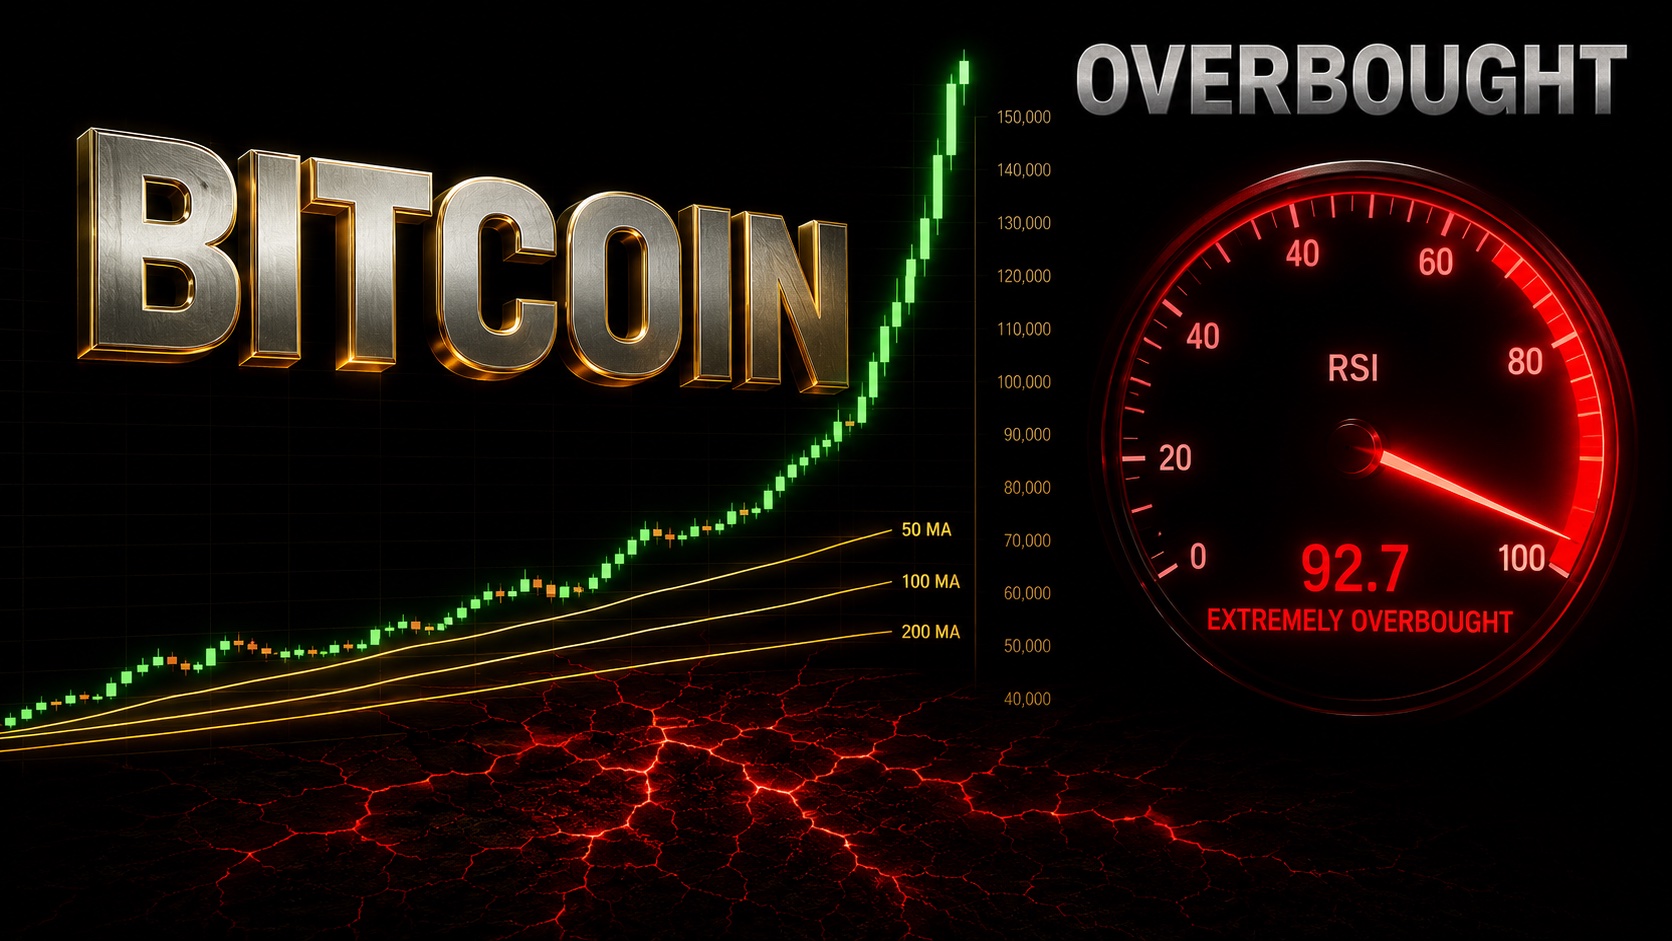
Bitcoin is now trading in overbought territory on almost every conventional reading.
- Daily RSI has been printing between roughly 82 and 84, well above the conventional 70 overbought threshold
- Price sits well extended above its 20-day, 50-day and 200-day moving averages
- The Fear and Greed Index is at 74, firmly in greed
- Solana’s 14-day RSI reached 81.74, so this stretch is market-wide, not Bitcoin-specific
None of this predicts a reversal. Strong trends can stay overbought for weeks, and an RSI reading is a description of momentum, not a forecast. What elevated RSI does reliably indicate is that the easy part of the move has already happened and that the risk of a sharp mean-reversion pullback has increased.
For perspective on how far Bitcoin still is from its highs: the 2026 peak of $94,820 was set in mid-January, and the all-time high of $126,198 dates to 6 October 2025. This has been a violent recovery inside a larger drawdown, not a fresh price discovery phase.
7. Bull and Bear Case
🐂 Bull Case
- Spot ETF inflows are genuinely positive, with IBIT leading at roughly $1.33 billion for the week, and that demand is recurring rather than one-off
- The Treasury buyback expansion is a real and continuing liquidity programme running through 4 November, not a single headline
- The heavy bearish leverage that capped every rally attempt for six weeks has now been flushed out of the market
- A regulatory framework with presidential backing is closer than at any prior point, even if passage this year is unlikely
- Breaking a six-week range on volume converts a former ceiling near $66,900 into potential support
🐻 Bear Case
- The dominant buyer was a risk engine, not an investor, and that buyer cannot return
- Roughly 92% of liquidations being shorts means the fuel for continuation has been consumed
- Daily RSI in the low 80s with price far above its major moving averages is a stretched setup
- The bond market itself erased the yield move within a day, suggesting the macro trigger was weaker than crypto’s reaction implied
- Prediction markets price CLARITY Act passage at only around 17%, so a 15 September cloture failure is the base case and would remove a pillar of the current narrative
- Leverage has migrated, not disappeared, and can now crowd on the long side just as easily
8. What Would Change the Thesis
The single most useful thing to watch is whether spot demand arrives to replace the forced buying that has now finished.
Constructive confirmation would look like: continued ETF inflows at or above the recent pace, Bitcoin holding above the old $66,900 range ceiling on a pullback, funding rates normalising rather than flipping sharply positive, and open interest growth accompanied by rising spot volume rather than only derivatives volume.
Warning signals would look like: ETF flows turning negative, price losing the broken range and closing back inside it, funding turning heavily positive as late longs pile in with leverage, or a failed cloture vote on 15 September removing the regulatory narrative while positioning is crowded on the other side.
That last scenario deserves particular attention. A market that has just squeezed shorts out is a market where leverage has room to rebuild on the long side, and a crowded long book into a binary political event is how squeezes run in reverse. The mechanics of leverage-driven reflexivity work identically in both directions, something we explored in the context of corporate Bitcoin holdings in our analysis of the MSTR liquidity spiral.
For readers weighing exposure across the majors rather than Bitcoin alone, our Ethereum 2026 outlook and our breakdown of Solana’s design tradeoffs cover the two assets that moved hardest alongside it this week.
FAQ
Was Bitcoin’s move to $80,000 driven by real buying?
Only partly. Spot ETF inflows were genuinely positive, with BlackRock’s IBIT taking in roughly $1.33 billion over the week. But nearly $2.8 billion of short liquidations hit in about 48 hours, so the majority of the buying pressure came from exchange risk engines force-closing positions rather than from investors choosing to buy.
What is the difference between a short squeeze and a real rally?
A real rally is driven by buyers who want the asset at the price they are paying. A short squeeze is driven by sellers who are compelled to buy back at any price to close a losing leveraged position. The first can continue indefinitely, the second stops as soon as the leveraged shorts are gone.
Does the CLARITY Act vote on 15 September mean the bill is about to become law?
No. The 15 September vote is a procedural cloture motion on whether to begin floor debate, and it requires 60 votes in a Senate where Republicans hold 53 seats. Polymarket traders currently price passage during 2026 at around 17%, and Galaxy Research recently cut its own estimate to about 10%.
Are Treasury bond buybacks the same thing as quantitative easing?
No. The Treasury is repurchasing its own outstanding debt, which changes the composition of government liabilities but does not expand the Federal Reserve’s balance sheet the way QE does. The label “stealth QE” is a market nickname, not an accurate description of the mechanism.
What does an RSI above 80 tell me about Bitcoin right now?
It tells you the market is stretched and that the move has been fast, not that a reversal is imminent. Strong trends routinely stay overbought for extended periods. The practical takeaway is that the risk of a sharp pullback has risen and that chasing an extended move is where retail investors most often get hurt.
Where would this rally need to hold to look structurally healthy?
The clearest technical test is the top of the old range near $66,900. A market that broke out on forced buying and then holds that former ceiling as support on a genuine pullback is demonstrating that real demand has replaced the mechanical demand. Failing back inside the old range would suggest the squeeze was the whole story.
Conclusion
Bitcoin above $80,000 is a real price, and the week’s 25% gain is a real gain. Neither of those facts tells you what produced it.
What produced it was, in the main, roughly $3 billion of one-sided leverage being unwound into a thin market, lit by a bond market intervention and a supportive political headline. The catalysts were genuine. The mechanism that turned them into a 25% move was mechanical, self-reinforcing, and now largely complete.
The biggest opportunity here is that six weeks of bearish leverage has been cleared away, and ETF demand is arriving into a cleaner market structure. The biggest risk is that investors read forced buying as conviction, add leverage near the top of an overbought move, and become the next crowded position on the other side of the book. What would change the thesis, in either direction, is spot demand: whether it shows up above $70,000, or whether the bid disappears the moment the risk engines stop buying.
Follow OneMoreBitcoin on YouTube for regular crypto market updates.
Disclaimer:
This article is for educational and informational purposes only. It does not constitute investment, financial, legal or tax advice, and it is not a recommendation to buy, sell or hold any digital asset.
Cryptocurrency is highly volatile and speculative. Prices can move sharply at any hour of any day, and you can lose some or all of the capital you invest. Digital assets are not bank deposits, they are generally not covered by deposit protection or investor compensation schemes, and the regulatory treatment of a token, platform or service can change quickly. Further risks include exchange or custodian failure, smart contract vulnerabilities, bridge and oracle failure, loss of private keys, and scheduled token unlocks that expand supply.
Investors should conduct their own due diligence and consider their own circumstances, time horizon and risk tolerance before making any financial decision. Consult a licensed financial adviser if you are unsure. Past performance is not indicative of future results.
OneMoreBitcoin and OneMoreMoney.com accept no responsibility for any loss incurred from reliance on the information provided in this article.